Largest study of its kind gauges community efforts to combat childhood obesity, a key risk factor for later chronic disease

LAWRENCE — According to the Centers for Disease Control and Prevention, one in five US school-age children and young people ages 6 to 19 years suffers from obesity, a tripling of such numbers since the 1970s. For individual children, genetics, eating and exercise all play a role in weight status — but the influence of a community’s design, programs and policies on childhood obesity hasn’t been comprehensively understood.
 Now, groundbreaking research appearing in the current issue of Pediatric Obesity represents the most wide-ranging investigation to date of how broadly and successfully communities across the U.S. implement programs and policies to prevent obesity in kids. The work also includes analysis of individual and community factors associated with positive change in childhood obesity.
Researchers Stephen Fawcett, Vicki Collie-Akers and Jerry Schultz at the Center for Community Health and Development at the University of Kansas’ Life Span Institute spearheaded the community measurement aspect of the work, dubbed the Healthy Communities Study.
“This is the largest study of its kind examining whether community investment in programs and policies to promote physical activity and healthy nutrition is associated with healthy weight — lower BMI, or Body Mass Index — among children,” said Fawcett, research professor at LSI. “No one had attempted to map the dose of community programs and policies actually being implemented in a large and diverse sample of U.S. communities.”
 Conducted between 2010 and 2016, the Healthy Communities Study looked at community policies and programs (CPPs) in each of 130 US communities, linking them to the weight status, eating habits and physical activity of 5,138 elementary and middle-school students in those locales. The sample included many children from low-income, Hispanic and African-American families. To estimate the dose of CPPs being delivered, the study’s researchers devised an intensity score that reflected the number of CPPs in place and their estimated strength, duration and reach.
“Analyses were conducted to see whether the intensity of CPPs was associated with lower BMI, or Body Mass Index, for children in the communities,” said Fawcett.
Among the study’s key findings:
- The intensity of community programs and policies is significantly associated with lower BMI in children.
- More comprehensive CPPs — those targeting a greater number of distinct behaviors related to physical activity and nutrition— were associated with lower child BMI.
- Community initiatives are more successful when CPPs are in place longer.
- Across the nation, there’s a broad range in the number and intensity of programs and policies aimed at promoting physical activity, healthy nutrition and healthy weight in kids. Some communities invest more in CPPs, others very little. These communities showed variation in the number and types of behavior-change objectives.
- Over time, investments in CPPs are increasing — and this matters for child health.
- For a community that goes from the minimum observed intensity score to the maximum, its children would see a reduction of -1.4 BMI units
- Communities that were predominately white benefited more from CPPs than those that were predominately African-American, with the least improvement in BMI seen for Hispanic children.
“This study has important implications for communities trying to assure a healthy environment for its children,” Fawcett said. “It suggests: Invest in programs and policies to promote physical activity and nutrition — lots of them, of strong form and reach, and targeted to the many different kinds of behaviors that promote healthier weight. To ensure that children are exposed to them, make sure that you’ve created changes in multiple sectors and settings through which children pass; like schools, parks, Boys & Girls Clubs and community organizations. Make sure they are in place long enough to make a difference. Six years or more was most effective. The exposure needs to be prolonged.”
Examples of community programs and policies to combat childhood obesity seen in U.S. communities include boosting availability of healthy foods in schools, encouraging kids to drink water instead of sugary beverages, increasing the amount of time that students are physically active, and building walking trails, parks, playgrounds and more pedestrian-friendly neighborhoods.
The KU research team emphasized the need to approach community programs with an emphasis on equity for populations of kids from different economic and cultural backgrounds.
“You need to bring an equity lens to designing community programs and policies intended to promote healthier weight among children,” Fawcett said. “You should not assume that all children will benefit equally from community investments that are not targeted and adapted to address children and families, such as African-Americans and Hispanics, that experience health inequities. What works in one community — predominantly white and affluent — may not work as well in a community where more supports for those experiencing health disparities are needed to assure healthy conditions for all our children.”
The study was made possible by a funding consortium that includes multiple Institutes of National Institutes of Health (NIH), the Centers for Disease Control and Prevention, the Robert Wood Johnson Foundation and other private foundations. The National Heart, Lung, and Blood Institute was the lead sponsor, with additional support from NIH’s National Institute of Child Health and Human Development, National Cancer Institute, National Institute of Diabetes and Digestive and Kidney Diseases and the Office of Behavioral and Social Sciences Research.
Top image:The researchers studied community programs and policies (CPPs) intended to combat childhood obesity, like the establishment of nutrition standards. Credit: iStock.
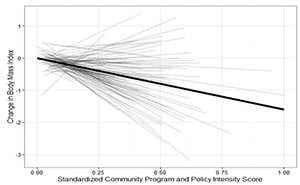
Top right image: This figure shows the relationship between CPP intensity scores and change in child body-mass index for each of the 130 communities in the study. The x axis, a measure of the dose, shows the standardized community program/policy intensity score—from the minimum possible of 0 (no CPPs) to the maximum of 1.0 (greatest amount and intensity observed). The y axis shows the response: the change in body mass index for participating children; from increased BMI (+1 or more for communities in upper portion) to lowered BMI (-2 or more BMI units for communities in lower portion). Credit: Center for Community Health and Development at the Life Span Institute.
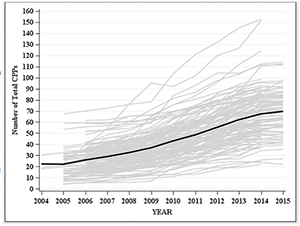
Bottom right image: The number of programs and policies in each of the 130 communities studied, in each year. The black line represents the average number of programs and policies across all communities. Credit: Center for Community Health and Development.