With unique data, researchers track the effect of Brazil’s ‘Soy Moratorium’ on an advancing agricultural frontier

LAWRENCE — The Brazilian state of Mato Grosso produces enough soybeans to be the equivalent of Iowa and Illinois put together. But it also plays home to lush Amazon rainforest, one of the richest, and most vulnerable, ecological treasures on our planet.
Using satellite imagery and unique ground-based information, the interface between highly mechanized agriculture and rainforest in Mato Grosso is shown with exceptionally granular detail in a new study led by Jude Kastens, research associate professor at the Kansas Applied Remote Sensing Program of the Kansas Biological Survey, and co-authored by J. Christopher Brown, professor of geography and atmospheric science and director of the Environmental Studies Program at the University of Kansas.
 Their paper appears April 28 in PLOS ONE.
 “Mato Grosso is a frontier in the sense that natural vegetation, both rainforest and savanna, known as cerrado, is being replaced with crop production and other agricultural uses,” Kastens said. “Mechanized agriculture moved rapidly into the area in the 1990s, so there’s a lot of opportunity for crop production and farm-related business development.”
Indeed, the researchers said agriculture in the area has a boom-town energy, generating billions of dollars annually that contribute to the state’s economy.
“There are cases of U.S. farmers selling everything in Iowa and moving to Mato Grosso in Brazil,” Brown said. “That’s a great indicator of being a frontier. There’s opportunity. I’ve often boarded planes for Brazil in Houston and waited in line with lots of farmers headed on tours in Brazil to scope out moving operations there.”
However, agricultural expansion has come at the expense of the Amazon rainforest. Concerns over widespread deforestation in the area led to a 2006 agreement between environmental groups and large agricultural corporations called the “Soy Moratorium.” Under the moratorium, major soy purchasers agreed to not buy soy produced on land deforested after July of that year.
“This begs the question — over such a large area, how are you going to know which deforested areas were replaced by soybeans after that date?” Brown said. “You need a really detailed land cover data set like we produced to know this.”
Kastens and Brown, along with KU colleague Christopher Bishop and Alexandre Coutinho and Júlio Esquerdo of the Brazilian Agricultural Research Corporation (Embrapa), relied in part on satellite datasets from the Moderate Resolution Imaging Spectroradiometer, or MODIS. By looking at images taken over 14 growing seasons, the researchers could examine changes in cropland location and production intensity across Mato Grosso. Most soy production in the Amazon Forest Biome occurs in this large state.
“The satellite images capture reflectance values from the ground in various wavelengths — the ones commonly used in vegetation studies are the red and near-infrared bands,” Kastens said. “Red light reflectance goes down as photosynthesis increases, whereas near-infrared reflectance goes up with denser leaf canopies. These two bands are combined to form the Normalized Difference Vegetation Index. NDVI signals from healthy soy fields will look different from healthy cotton fields, which will look different from other cover types.”
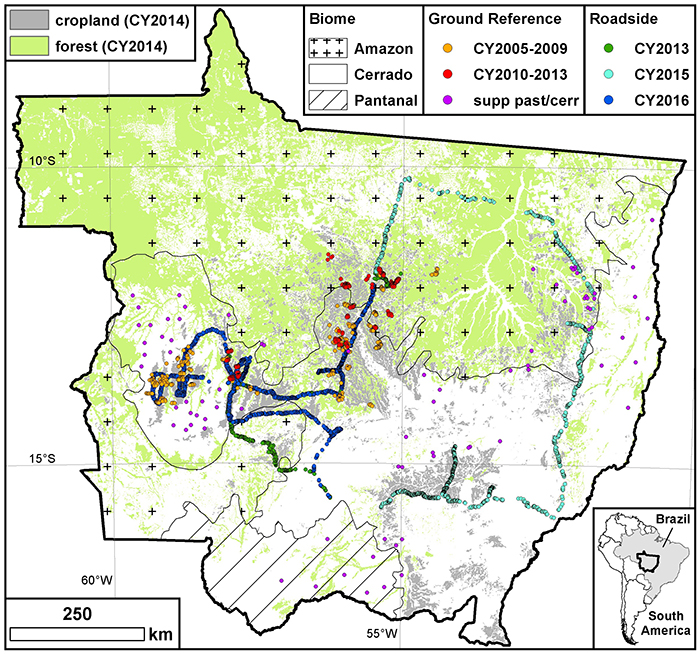
To interpret the satellite data, co-authors from Embrapa, the Brazilian equivalent of the USDA, collected an unprecedented amount of ground reference data in Mato Grosso by interviewing farmers. In 2006, the KU and Brazilian researchers began working under a memorandum of understanding to share methods in ground data collection and land cover classification. Since then, the researchers have visited each other’s labs and carried out field work together.
“The wealth of ground reference data made this research possible,” Brown said. “There hasn’t been anything like this for such a large area outside the U.S. Our colleagues worked with farmers to trace field boundaries on printed satellite imagery and give cropping histories for various parcels of land.”
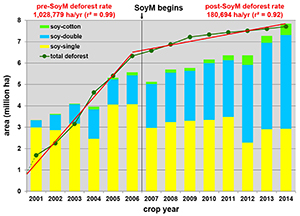
A major finding of the research suggests the 2006 Soy Moratorium had a larger effect in reducing deforestation in the Amazon than has been previously understood.
“Based on our analysis, we found a much stronger deforestation decline coincident with the Soy Moratorium than other studies have reported,” Kastens said. “The Soy Moratorium has been downplayed in some research as a factor in deforestation reduction. Our examination of essentially the same deforestation dataset used by others revealed a major decline in deforestation occurred immediately after the moratorium took effect.
“Deforestation is still happening, but it has slowed, and less of this land is being used for soy production,” Kastens said.
The study incorporated deforestation data produced by the Brazilian Institute for Space Research (INPE).
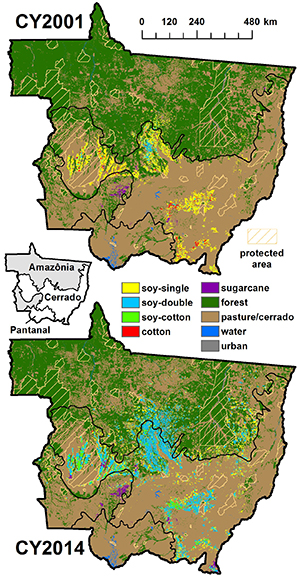
The team also found a sharp rise in production on existing cropland after the moratorium, dubbed “vertical intensification,” while deforestation-driven cropland expansion, or “horizontal intensification,” slowed substantially.
“With vertical intensification, we see a dramatic increase in double cropping, where farmers plant a first crop of soybeans followed by a second commercial crop, typically corn, in the same growing season and field,” Brown said.
The researchers are making their land cover data freely available. They hope it will help guide land managers and policymakers looking to strike a balance between farming and conservation.
“The rain forest helps regulate many climate-related factors in the Amazon basin and nearby regions, including temperatures and the hydrologic cycle,” Kastens said. “It has obvious ecological value and is a biodiversity hotspot with many untapped natural resources.”
The Amazon is also home to many native populations.
“Indigenous people in rain forest reserves are being completely surrounded by these soybean fields, many of which are upstream,” Brown said.
Kastens added, “Researchers can utilize our map data, with its detailed spatial and class resolutions, to examine market accessibility impacts and other agricultural frontier-related questions, as well as issues related to climate, ecology and human geography.”
Images: 1. Study area (Mato Grosso). Forest and cropland geography as of crop year 2014 are shown along with biome boundaries and the locations of the ground reference and roadside data points. 2. Mato Grosso land cover for crop years 2001 and 2014. Final land-cover maps are shown for crop years 2001 and CY2014. Biome boundaries, which are overlaid on the land-cover maps, are labeled on the inset map. Protected areas (indigenous reserves) are also shown on the land-cover maps. 3. Map area totals for deforest and soy. Map-based areal data summaries for accumulated deforestation and annual soybeans are shown. Pre-soy moratorium and post-soy moratorium deforest trend lines are also depicted, with respective regression slopes provided in red text above the graph. A value of 0 was assigned to crop year 2000 to anchor the pre-soy moratorium total deforest trend line in the same manner that crop year 2006 is used to anchor the post-soy moratorium total deforest trend line.