KU study tracks 43 years of intellectual and developmental disability funding trends

LAWRENCE — In the weeks before and after passage of the federal One Big Beautiful Bill Act last summer, some of the most vocal critics of the bill’s changes to Medicaid were those worried about the effect Medicaid cuts could have on individuals with intellectual and developmental disabilities, or IDD, and their families.
Along with personal experiences describing how supports had helped individuals live in their communities, preserved independence or obtain employment, Medicaid and policy advocates cited longitudinal state and national data analyzed for more than four decades by a University of Kansas research team.
The researchers, who are based at the KU Life Span Institute, have now published findings that show that federal and state expenditures assisted almost 1 million people with intellectual and developmental disabilities nationwide with support for health care, home and community-based services (HCBS) and other areas and supports for fiscal year 2023, the latest year for complete figures.
“There is a lot of work that still needs to be done to ensure people with IDD and their families have the supports and services necessary for quality-of-life outcomes,” said Shea Tanis, associate research professor at the KU Center on Disabilities and director of the research project.
“But," she added, "without national data, it is challenging to make informed decisions and implement policies that lead to meaningful change.”
State-by-state investments published in the findings include:
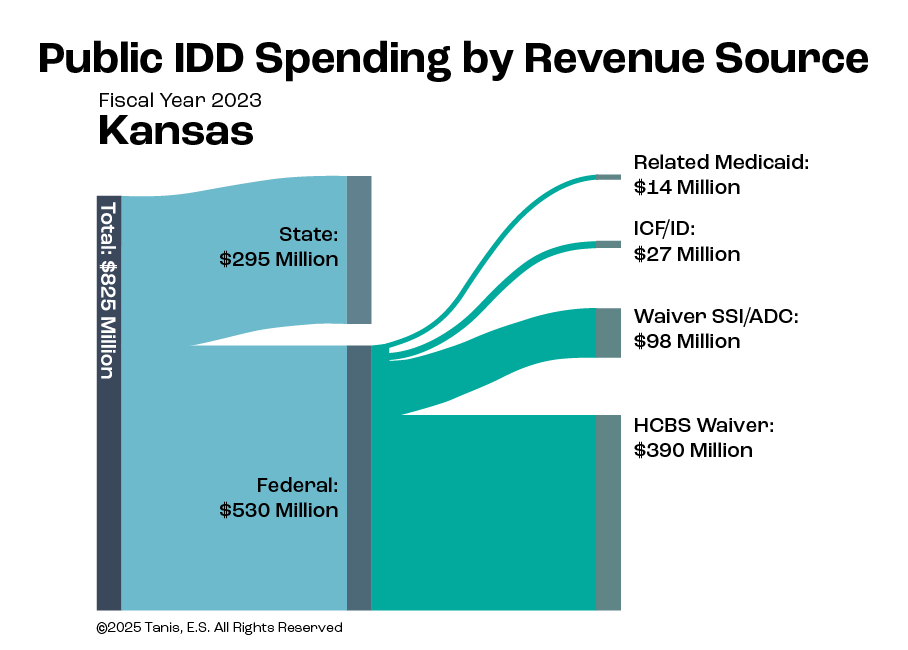
- Kansas (PDF): $689.6 million in total spending for services, an increase from the pre-pandemic 2019 measure of $641.5 million.
- Missouri (PDF): $1.8 billion in total spending for services, up from the 2019 measure of $1.7 billion in 2019.
- Washington (PDF): $2.01 billion in total spending for services, up from the 2019 total of $2.28 billion.
- Illinois (PDF): $2.7 billion in total spending for services, an increase from $2.5 billion in 2019.
The data published by the State of the States in Intellectual and Developmental Disabilities Ongoing Longitudinal Data Project of National Significance Project includes extensive, tailored reports with analysis for each state to describe financial investments for fiscal year 2023 and across time. They include analyses that break down spending by services and revenue source, and they provide figures on types of employment, living arrangements and the age of caregivers.
The federally funded project was established by the Developmental Disabilities Act of 2000.
Tanis is nationally recognized for her expertise in applied technology solutions, cognitive accessibility, and advancing the rights of people with cognitive disabilities to access information and technology.
Tanis said that documenting financial investments longitudinally allows policymakers to see the fiscal impacts and progress — even slow or gradual progress — that aligns with the priorities of advocates and family members, both nationally and on a state-by-state level.
“These expenditures demonstrate our expectations and priority to advance full-participation, equal opportunity, economic self-sufficiency and independent living for people with disabilities as outlined in the Americans with Disabilities Act,” Tanis said.
Big picture: federal and state investments
The researchers provide information in several forms, including detailed state profiles, customized data briefs designed for and by users with disabilities, interactive data visualizations and comprehensive national U.S. reports.
Revenue source
Of the FY23 total of $105 billion, State of the States researchers showed that the federal government spent $60.2 billion, states spent $43 billion, and local programs spent $1.37 billion on programs that help support people with intellectual and developmental disabilities. Those totals were a shift from the pre-pandemic 2019 measures, which showed a $53.3 billion federal investment, $38.9 billion at the state level and $1.5 billion in local expenditures.
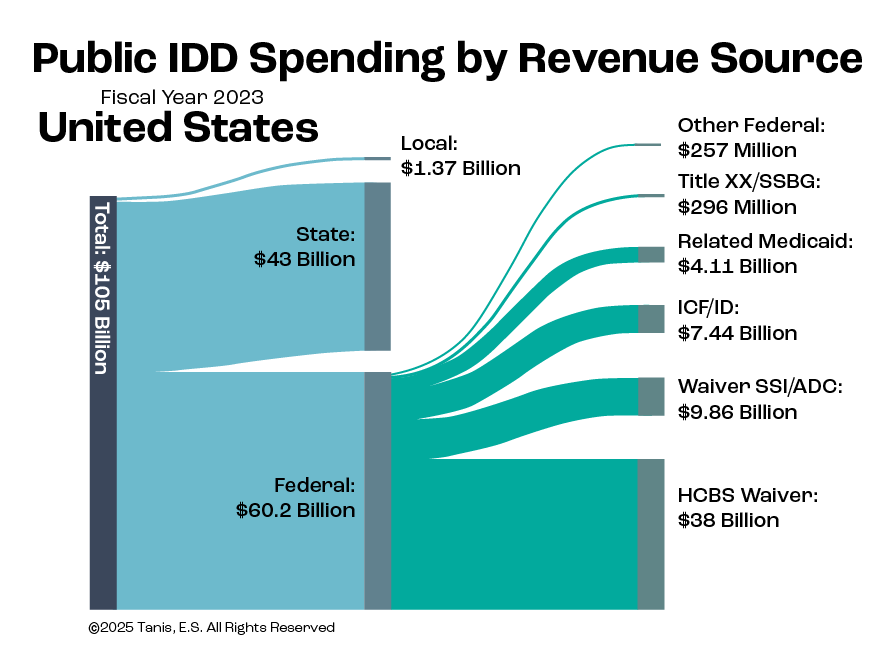
The research breaks down the combined federal-state expenditures at the state level and their source. For example, the state of Washington invested $2.44 billion in supports and services for individuals and families. That includes $1.42 billion from federal sources, $1.01 billion from state resources and $16 million from local investments.
In Kansas, public spending for intellectual and developmental disability supports and services totaled $825.4 million, a combination of $530.1 million in federal resources and $295.3 million in state resources.
Reflecting an increase in supports during the COVID-19 pandemic and more investment in community services, the researchers showed that the U.S. spent about $70,500 per Medicaid waiver participant in FY23. The figure is a difference of about $14,200 since FY93. It’s also an increase of $10,600 per participant from FY2015, the lowest point documented by the researchers since the project began tracking the information.
National and state trends in individual and family supports
To identify trends, the researchers distilled expenditures across several areas. One of these is individual and family supports, looking closely at supported and personal assistance, family supports and supported employment.
The national analysis showed that for the period of FY2017-FY2023:
- Supported living and personal assistance provided assistance to 387,894 individuals and totaled $18 billion in FY2023, up from $13.7 billion in FY17. Personal assistance and supported living have advanced as the priority living situation for individuals with intellectual and developmental disabilities.
- Family supports, which provide financial support and provide for other needs for families with a child or adult with IDD, supported 602,856 individuals, increasing from $9.2 billion in FY2017 to $11.1 billion in FY2023.
- Supported employment has fallen slightly from $1.2 billion FY2017 to $1.1 billion in FY2023 and in the most recent figures served about 107,000 people. Supported employment can be assistance in obtaining and keeping competitive integrated employment, including customized employment in traditional settings.

In Kansas, no individuals received supported living and personal assistance in FY2023, while 669 participants received family supports through an investment of $15 million in 2023, up from a low point of $1.8 million in FY17.
Supported employment has fluctuated significantly in the state, ranging from about $56.5 million in FY15 for 2,686 participants to $1.2 million for 3,923 participants in FY23.

Documented decreases in institutional care settings
The Administration for Community Living, which administers federal grant funding for the State of the States project, noted in a significant 2017 report that for about 100 years, parents were told to send their children with IDD to institutions for care. They entered institutions as children and most never left, and the institutions were known for terrible conditions.
In the 1960s, conditions began to improve with greater investment from Medicaid and implementation of supports for legal and civil rights for people with disabilities. Between 1987 and 2017, four out of every five people with IDD who lived in institutional settings moved to community settings, such as smaller group homes, or on their own or with family.
The ACL notes that research has shown that people with IDD who live in smaller settings "have more choices, do more in their communities and have better lives than those in institutions."
Every state's investment is different, Tanis said. To compare the changes in state investments in community and congregate settings over time, State of the States researchers use a measure called fiscal effort, defined as spending on intellectual and developmental disability services per $1,000 of aggregated statewide personal income. In the latest figures, about $4.66 per $1,000 of personal income nationwide was spent on IDD-related services.
The researchers noted that community fiscal effort, or funds expended to support people in smaller group or individual settings, has increased nationally from about 55 cents in FY1977 to $4.30 in FY2023. At the same time, the institutional fiscal effort — the amount invested in larger facilities — has decreased from $1.65 to 35 cents, demonstrating the nation’s alignment with advocates and national priorities to shift away from large institutional settings, Tanis said.
In a comparison of costs and settings for FY2023, the researchers showed that the annual cost of care ranged from $46,600 for supported living settings, while state-operated settings that serve 16 or more people cost $395,600 per resident in FY2023.
However, Tanis said that as states address federal funding uncertainty, tough decisions will need to be made by legislators regarding Medicaid-funded services and supports.
“If states have fewer resources to allocate from Medicaid, they may shift to a greater emphasis on institutional settings and reduce optional coverage of HBCS,” Tanis said.
![“If states have fewer resources to allocate from Medicaid, they may shift to a greater emphasis on institutional settings and reduce optional coverage of [Home and Community Based Services]." Director of the States of the States in IDD, Shea Tanis, Ph.D.](https://news-archive-assets.ku.edu/data/b5/10/01kk24d564xdfjxbtag79cgzd1.png)
In Illinois, Tanis pointed out that the state’s recent investments are helping more residents with intellectual and developmental disabilities to live in their home communities, where research shows that people have better health outcomes. Investments in federal- and state-funded HCBS waivers have increased from $281.8 million in FY2013 to $398.3 million in FY2023.
A look at 10 years of data for Illinois shows that the number of people who live in facilities with 16 or more people has increased from 6,207 in FY2013 to 6,785 in FY2023. However, during that same period, the state has greatly increased investments to allow people to live in smaller settings.
The state’s report shows that the number of individuals in settings with six people or fewer has increased from 9,910 participants in FY2013 to 17,352 in FY2023.
On data processes and state data comparisons
To determine information published by the State of the States, the research team collects data from state departments of developmental disabilities or related agencies. They use secondary datasets and national datasets from the U.S. Census Bureau, Medicare and Medicaid, and Social Security Administration data to check findings, analyze and draw conclusions.
The data is complex, and it’s not available in real time because it focuses on real expenditures from states and national data sources that are often released with a two-year lag, Tanis said. That reflects both the scope of the project and the nature of financial information.
Before analyses are published or distributed, they are reviewed and confirmed by the state IDD agencies to make sure study results are valid and reliable.
Another aspect of the research — one that confounds many state policymakers — is that while states may want state-to-state comparisons, it’s difficult, if not impossible, to do with the data.
“Each state has its own complex and diverse constellation of political, fiscal and program variations,” Tanis said. “We encourage states to use the decades of data available as a yardstick for their own progress over time.”
When speaking to state lawmakers, Tanis said she often has to emphasize that data doesn’t manifest out of nothing.
“It’s important to understand how we get robust and rigorous data, the methodologies behind it and to understand the complexities that make it nearly impossible to compare one state’s expenditures to another’s,” Tanis said.
That’s also one of the reasons it’s important to have, and continue to fund, longitudinal data studies of the data, so that each state knows how it has changed over time, she added.
43 years of data, but an uncertain future
Tanis crisscrosses the country for legislative, policy or advocacy conferences and meetings. Through those opportunities, she has been surprised repeatedly by the lack of knowledge of IDD history.
Fewer leadership and policymakers today seem to be aware of the critical importance of the interwoven parts of the Developmental and Disabilities Assistance and Bill of Rights Act of 2000, often called the DD Act, or the overall history of support for people with intellectual and developmental disabilities and the deinstitutionalization movement.
While data collection for the State of the States project began about two decades before the DD Act, the bill codified the modern network of data collection, research, advocacy and support in place today. It established the three “Ongoing Longitudinal Data Projects of National Significance,” including the State of the States project.
Those projects in turn analyze and provide data to state developmental disability councils established by the law, and they support the research and outreach conducted by university developmental disability research centers, or UCEDDs. Kansas is home to one such center, the KU Center on Disabilities.
In April 2025, a draft of the federal budget circulated publicly. It called for eliminating funding for several programs that support individuals with intellectual and developmental disabilities, included funding for the State of the States project and the other two Ongoing Longitudinal Projects of National Significance, as well as the support for UCEDDs and state disability councils.
Tanis said that the proposed cuts would end research that has for four decades provided the information needed by policymakers, IDD professionals, researchers, advocates, and individuals with intellectual and developmental disabilities and their families.
For now, through the end of 2026, the project has been funded.